
Every year, SAIS member schools contribute to a collective dataset defining school structure and operations. This year’s survey covers teacher and administrator salaries, tuition remission, and board structure. Whether you are a head of school weighing a compensation decision or a trustee trying to understand what peer schools look like, the findings below offer a starting point for a more informed conversation.
Meridian is SAIS’s interactive benchmarking dashboard, where member schools can explore Annual Benchmarking Survey results in more depth. The full Meridian dashboard is available to all SAIS member schools. Access is granted to heads and CFOs unless additional specific roles have been requested by the school.
The findings in this article are high-level summaries drawn from the data. Member schools who want to look further, including comparisons that fit their own size, budget, and location, can do so in Meridian.
Teacher Salaries
The starting and 5-year median bands did not change between 2025 and 2026. The master’s + 10-year median moved up one band, from $55,000-$59,999 in 2025 to $60,000-$64,999 in 2026. Schools reporting below public-scale pay stayed roughly flat, around 57% to 59%.
| Position | Median Range | Middle 50% of Schools |
| Starting teacher | $45,000-$49,999 | $40,000-$44,999 to $50,000-$54,999 |
| 5 years | $50,000-$54,999 | $45,000-$49,999 to $55,000-$59,999 |
| Master’s + 10 years | $60,000-$64,999 | $50,000-$54,999 to $65,000-$69,999 |
Salaries track budget size closely. Schools with budgets at $40M and above report 37% equivalent with and 31% above local public school scales.
What Drives Teacher Pay?
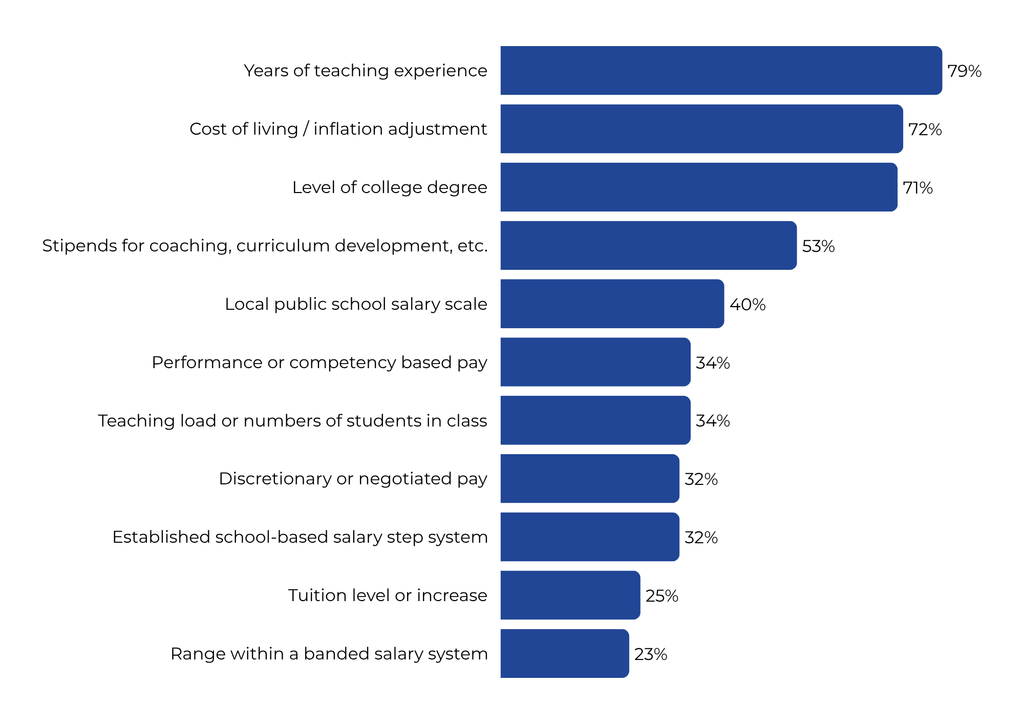
When setting individual teacher salaries, schools overwhelmingly set individual pay around three things: years of teaching experience, cost of living or inflation adjustments, and the teacher’s level of college degree. Together, these describe a salary system built mainly on tenure and credentials, adjusted for the local economy. That pattern suggests most schools have a fairly predictable baseline for each teacher, even if the details differ from school to school. Schools could select more than one, so the percentages add to more than 100%.
Tuition Remission
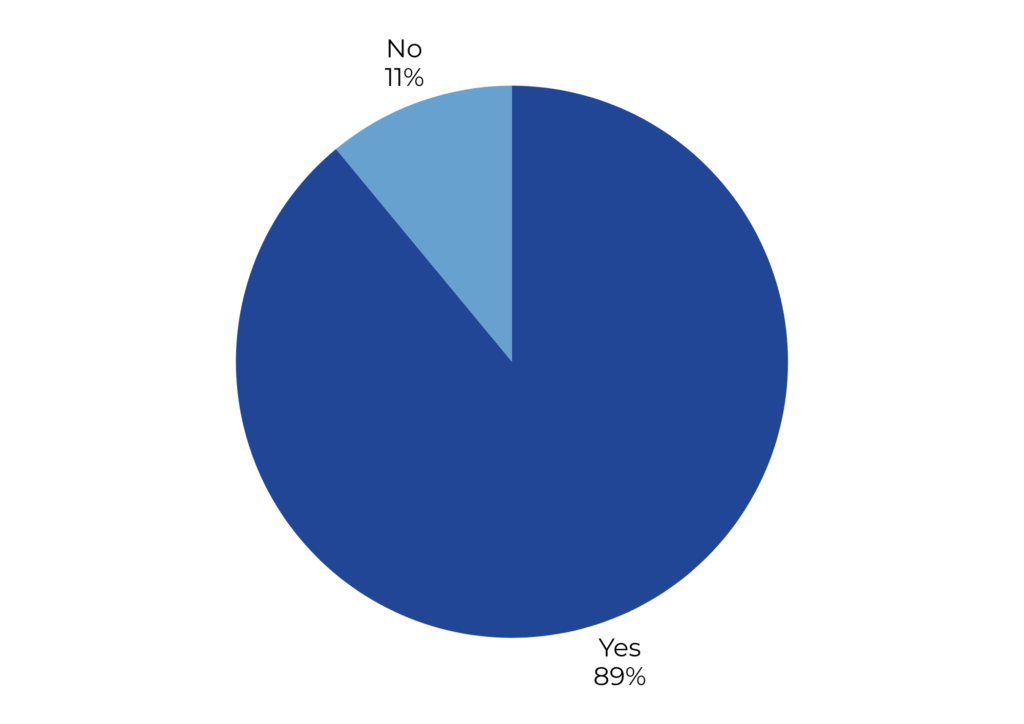
About 89% of schools offer tuition remission or preferred financial aid to full-time instructional faculty.
Among schools that offer it, the most common level for the first child is 26% to 50% of tuition; 71% apply the same percentage to all children with no maximum.
Administrative Pay
Across all schools, base salaries for division directors cluster tightly. The middle half falls between $70,000-$79,999 and $120,000-$129,999, a span of about $50,000. Division leadership pay is relatively consistent across schools of similar size, while the broader administrative team varies more widely as budgets grow.
The CFO role sits at the top, followed by the upper school director and advancement roles. The CFO range is also the widest, which suggests the role varies a great deal from school to school. The early childhood role is the least common, more likely to be a 10 month position and lowest paid.
Administrator salaries also track budget size. The CFO median ranges from $70,000-$79,999 for schools under $4M to more than $250,000 for schools at $40M and above. The upper school director median rises from $70,000-$79,999 to $190,000-$199,999 across the same tiers.
Board Structure
Boards at member schools share many common practices, but the details can vary on how they are set up, from term limits and committee structure to the presence of parent trustees.
| Size: The median board falls in the 10 to 14 voting trustee range. About half of boards have 14 or fewer voting members, and about 23% have fewer than 10. | Parent trustees: In about 21% of schools, current parents make up 10% or less of their board. |
| Trustee terms: Three years is the most common term for trustees, with 78% of schools reporting this structure. | Committees: The median school has 4 to 5 standing committees. The most common are Finance/Budget, Advancement/Fundraising, Executive, and Governance. About two-thirds allow non-trustees to serve on committees. |
How might schools use these findings in their own planning?
- Start by choosing your comparison group. Identify the budget tier closest to your school’s annual operating budget, then use the Meridian benchmarks for that tier as your primary point of reference.
- Map your starting salary to the local public school pay scale. Pull the current public school salary schedule for your county or nearest metro area, then compare your starting teacher salary to it. If you fall below the public scale, and the data show that most schools in your tier are in the same position, this can help you frame the gap as a planning decision rather than a failure. Set a multi-year target, such as closing half the gap over three budget cycles, and track progress against it.
- Build your salary structure around bands, not single numbers. Meridian collects and reports salaries as ranges, and schools can do the same internally. Define a range for each step or experience level, place each teacher within it, and review the ranges annually against the public school scale and the benchmarks. This makes it easier to explain pay decisions to faculty and to adjust when the market moves.
- Review board bylaws against peer practice. Check your term length, consecutive-term limit, number of standing committees, and whether non-trustees may serve on committees. Note where your school is typical and where it differs. Differences are not problems, but they are worth discussing with your governance committee.
- Set a date to revisit your numbers. Salary and governance practices shift slowly, but Meridian gives schools a consistent annual reference. Schedule a review each year against your own figures so that you can see your trajectory as well as your position.
Questions for Your Leadership Team and Board
- When we set salaries each year, which factors carry the most weight for us, and do faculty members understand how those factors are applied?
- If a teacher with ten years of experience and a master’s degree asked how their pay compares with what they could earn at the local public school, what would we say, and would we be comfortable with that answer?
- If we lost a strong teacher this year, what would the most likely reason be, and what would it cost us to replace them?
- Which of our administrative roles have grown in responsibility over the past three years, and does each job description reflect that growth? Do our current salary ranges still match the work people actually do, and when did we last review this?
- What share of our operating budget goes to salaries and benefits? How does this compare to schools of similar size or budget?
- When did our board last discuss term limits, committee structure, or succession planning?