
What DASL, the Meridian Dashboard, and the Governance Health Index Reveal About Board Health
By Dr. Jeffrey L. Mitchell, Head of School, Currey Ingram Academy
Overview
Trustees in SAIS schools are giving and giving more: median trustee dollars received rose 16% in two years, and the lowest-giving quartile of SAIS boards grew fastest, up 58%. Board size, giving requirements, and participation mirror the NAIS dataset.
SAIS’s Meridian survey of 373 schools shows why the giving has not become asking. Boards have built committees for money and fundraising (94% finance, 71% advancement) but not for strategy (26%), head evaluation (17%), or innovation (1%). Nearly half are majority current-parent boards, one in four allows unlimited consecutive terms, and half sit within two seats of their bylaw maximum. The structure is built for oversight, not for reach.
When nearly 400 SAIS trustees evaluated their own boards through the Governance Health Index, the weakest scores landed on fundraising leadership and external engagement, and a quarter flagged succession planning and trustee development as limited or developing. Boards give personally but are not yet comfortable, or trained, to ask.
The gap between the checkbook and the ask is the story of this FastStats, and, at its core it’s a strategic-direction problem: boards that cannot articulate where the school is going find it hard to invite others to fund the journey.
Introduction
Governance is the quiet infrastructure of an independent school. Like the plumbing, nobody notices it when it works, and everyone notices when it fails. For this Board Bulletin, whose theme is Strategic Direction, I looked at governance through three lenses: what boards give, from NAIS Data and Analysis for School Leadership (DASL); how boards are built, from SAIS’s Meridian Dashboard survey of board structure; and what boards believe about themselves, from SAIS’s Governance Health Index (GHI) board self-evaluation.
The three diverge, and this is where a head and a board chair should spend some time. Readers of the earlier FastStats on governance beliefs (SAIS surveys, 2016-2019; 49 heads and 784 trustees) will remember its essential finding: wherever heads and trustees disagreed about whether best-practice governance was happening, heads agreed less. Trustees are, in general, a generous audience for their own performance. Keep that in mind as you read the self-evaluation results.
About the Data
- DASL trustee data. A custom DASL report (September 23, 2026) comparing All NAIS Member Schools (universe 1,718) with the SAIS cohort (universe 345) across data-entry years 2023-24 through 2025-26. Advancement items describe funds received in the prior fiscal year, so the 2025-26 column reflects 2024-25 giving. Fewer schools answer each item than the universe; the n is shown on each chart where DASL reports it.
- Meridian board-structure survey. Raw responses from 373 schools (GA 105, NC 64, TN 63, FL 33, and 11 other states or international) on board size, parent trustees, bylaw limits, term limits, standing committees, and non-trustee committee service, with enrollment, budget, and affiliation. Meridian reaches well below DASL’s NAIS-member subset: 40% of these schools run on budgets under $6M. Where the sample supports it, simple inferential tests (chi-square, Spearman, Kruskal-Wallis) at the conventional p < 0.05 threshold are reported.
- Governance Health Index self-evaluation. SAIS’s 2025-26 pilot: 28 schools and approximately 400 trustees rating their boards on a four-point scale (1 = limited, 2 = developing, 3 = proficient, 4 = exemplary) across six competencies. Working from SAIS’s summary of the results.
Part 1. What Boards Give: The DASL Picture
Board Size: Eighteen is the Number
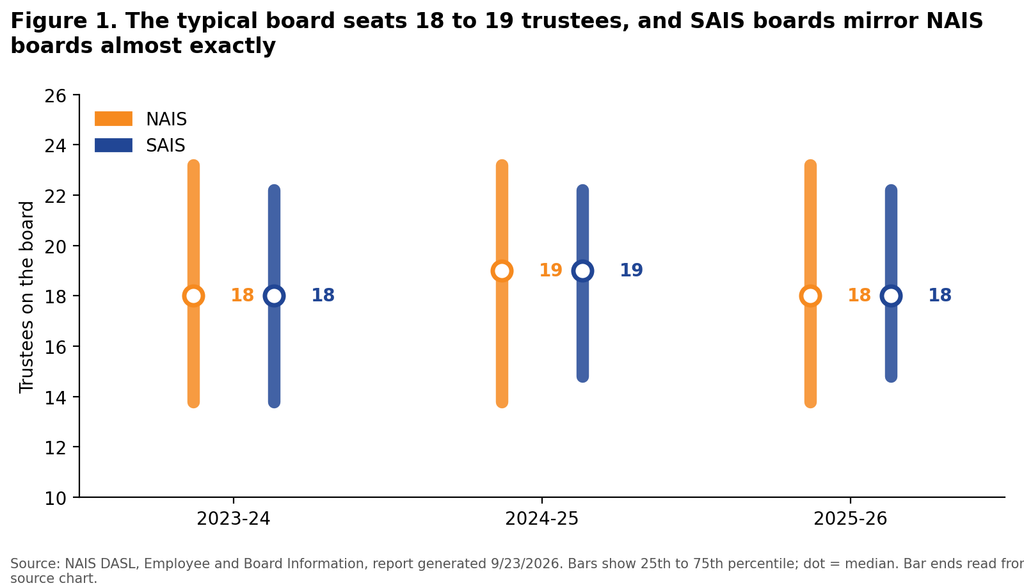
Figure 1 shows board size for NAIS and SAIS schools. The median board has 18 to 19 trustees, with the middle half of schools between 14 and 23; SAIS boards run a hair tighter at the top (75th percentile 22 versus 23). Nothing moved in three years. Eighteen is large enough to populate five or six committees. The more useful question is not how many trustees you have but how many are doing the work the GHI describes.
The Giving-Requirement Paradox
Figure 2 is interesting. Only about one in five schools, NAIS or SAIS, formally requires trustees to give. For SAIS, the percentages for the past three years are 20%, 23%, and 18%.
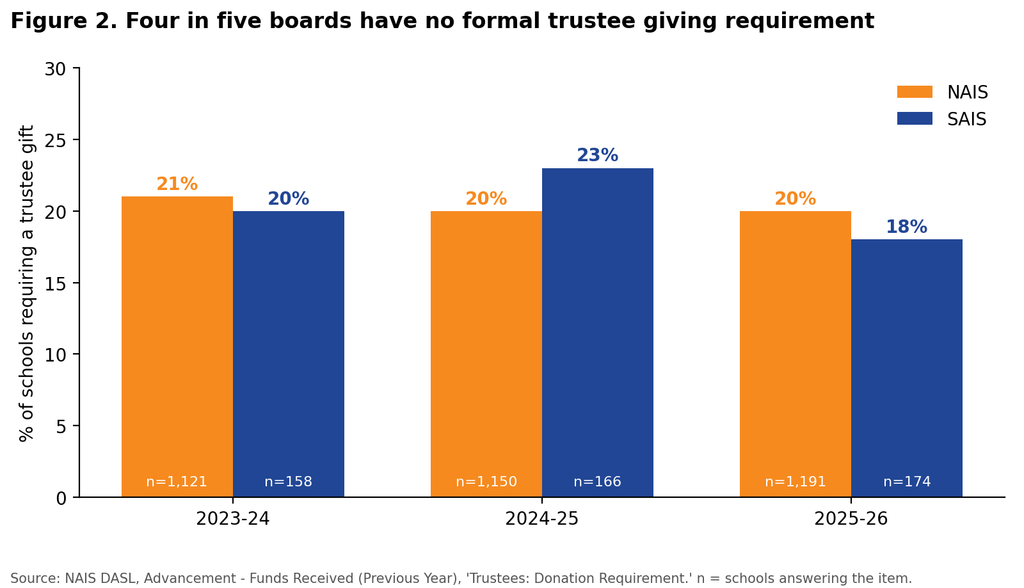
However, the DASL trustee donor count (18 to 19) matches the median board size (18 to 19) every year for both cohorts. The typical board reaches effective full participation without a written rule. Culture, not policy, is doing the work. That also explains something in the GHI results. Trustees who already give may not see why they need philanthropy training; in their own minds, they have done their part.
Trustee Giving: Rising, and Rising Fastest at the Bottom
Figure 3 tracks median total trustee gifts received per school. NAIS schools grew from $183K to $223K, a 22% increase. SAIS started ahead ($187K), pulled further ahead in 2024-25, then plateaued while NAIS caught up. A 16% two-year gain is still well ahead of tuition inflation, and one flat year is not a trend, but the pledge data in Figure 5 suggest why the plateau may have occurred.
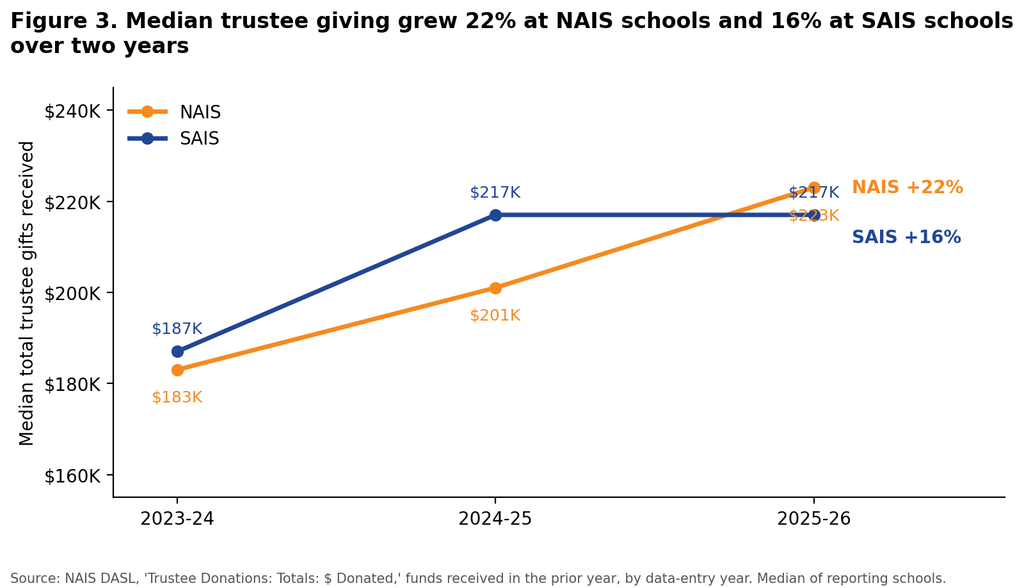
Divide median dollars by median board size, and you get roughly $12,400 per trustee at NAIS schools and $12,100 at SAIS schools, a useful comparison for your own board. If your eighteen trustees gave $80,000 last year, you are in the bottom quartile of the association; at $540,000 you are in the top quartile.
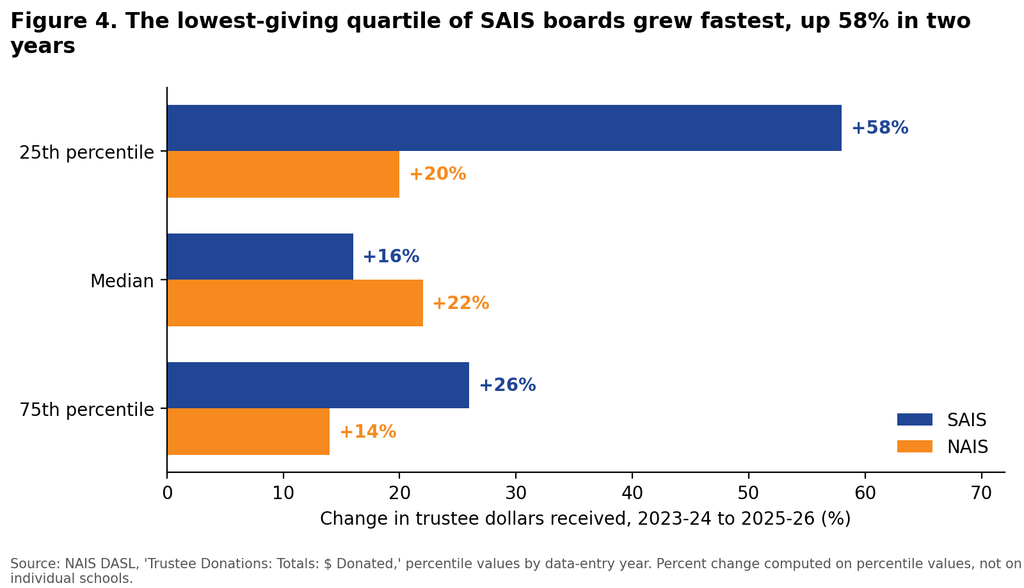
Figure 4 breaks the two-year change out by quartile, and here SAIS tells a distinctive story. The 25th-percentile SAIS school rose from $57K to $90K, a 58% jump and nearly three times the NAIS rate at that quartile; the SAIS top quartile also outgrew its NAIS counterpart (26% versus 14%). Only at the median did SAIS lag. My reading: a $57K floor usually means a handful of trustees not giving at all, and the fix is a conversation, not a campaign.
Received Versus Committed: A Small Warning Light
DASL captures two philanthropic moments: “dollars received” is cash in the door, “new funds committed” is the pledge line. Figure 5 indexes both back to 2023-24.
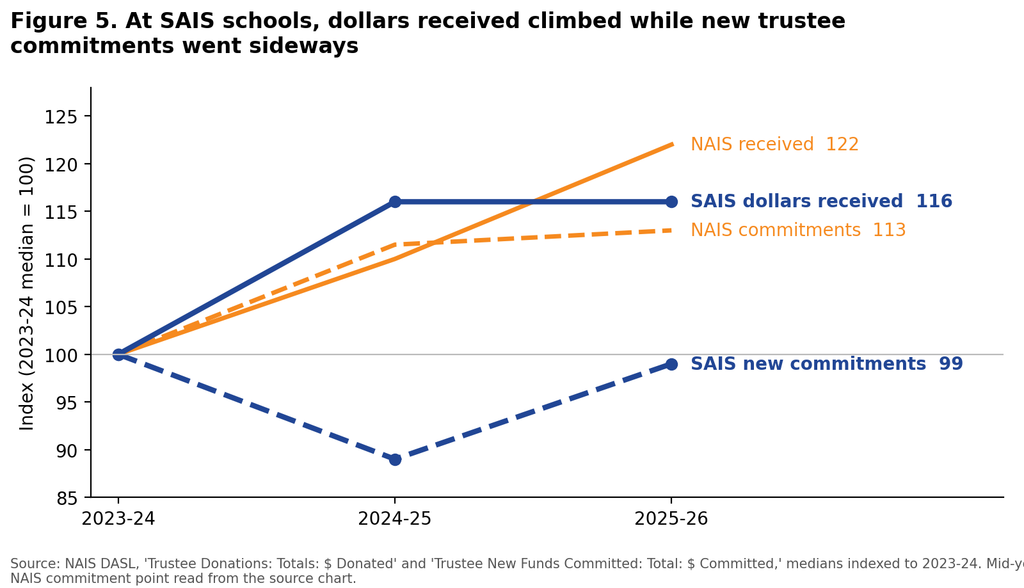
At NAIS schools, both lines rose together, which is what a healthy pipeline looks like: this year’s commitments become next year’s receipts. At SAIS schools, receipts rose 16% while new commitments dipped 11% and merely recovered. A pledge line that goes sideways while cash climbs usually means schools are harvesting earlier commitments without replenishing them, or trustees are giving outright annual gifts rather than multi-year pledges. Either way, it foreshadows a flatter receipts line, which is exactly what the SAIS median showed in 2025-26.
A caution: the SAIS 75th percentile for commitments swung from $742K to $372K to $758K in consecutive years, so a few large campaign pledges are moving the distribution. This is a warning light, not a fire, but it is the kind of leading indicator a development committee should watch, and it connects directly to what trustees told SAIS about their comfort with asking.
Who Sits at the Table: A Transparency Trend
Figure 6 shows a decline that has nothing to do with money. The share of schools collecting race and ethnicity data on trustees fell from 88% to 55% at NAIS schools and 85% to 57% at SAIS schools in two years, even as more schools answered the item. DASL flags the variable as new in 2024-25, so the 2023-24 baseline may reflect different wording. So, I would be careful not to stake too much on the exact size of the drop.
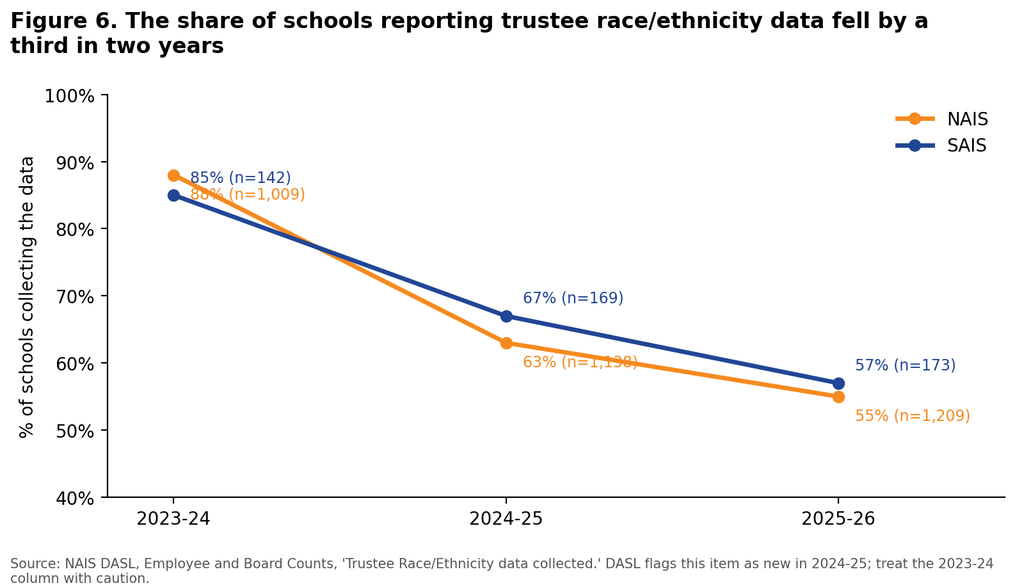
The data do not say why; the decline coincides with a shifting legal and political environment. I raise it for one reason. The GHI’s Talent Cultivation competency asks boards to recruit “the expertise and diversity of skillsets and backgrounds necessary,” and a board that has stopped measuring its own composition cannot answer that question as well. Whatever your position on the underlying issues, a board should at least know who it is.
Part 2. How Boards are Built: The Meridian Picture
DASL tells us what boards give, not how they are constructed, and construction is where governance habits are set. Meridian asked 373 schools the structural questions, and because it reaches far more small schools than DASL, I can filter the answers by budget and test whether the differences are real.
Board Size Scales, and DASL’s Median is the Big-School Median
Figure 7 shows board size by operating budget: a median of 9 voting trustees under $4M, 13 at $4-10M, 16 at $10-20M, and 20 at $20M and up. Board size correlates with enrollment band at rho = 0.39 (p < 0.001), a moderate and unmistakable relationship. The Meridian-wide median is 15, three seats below DASL’s SAIS median of 18, and the gap is not a contradiction: DASL’s SAIS cohort is the NAIS-member subset, which skews large. The DASL benchmark is right for a $20M school and wrong for a $3M school.
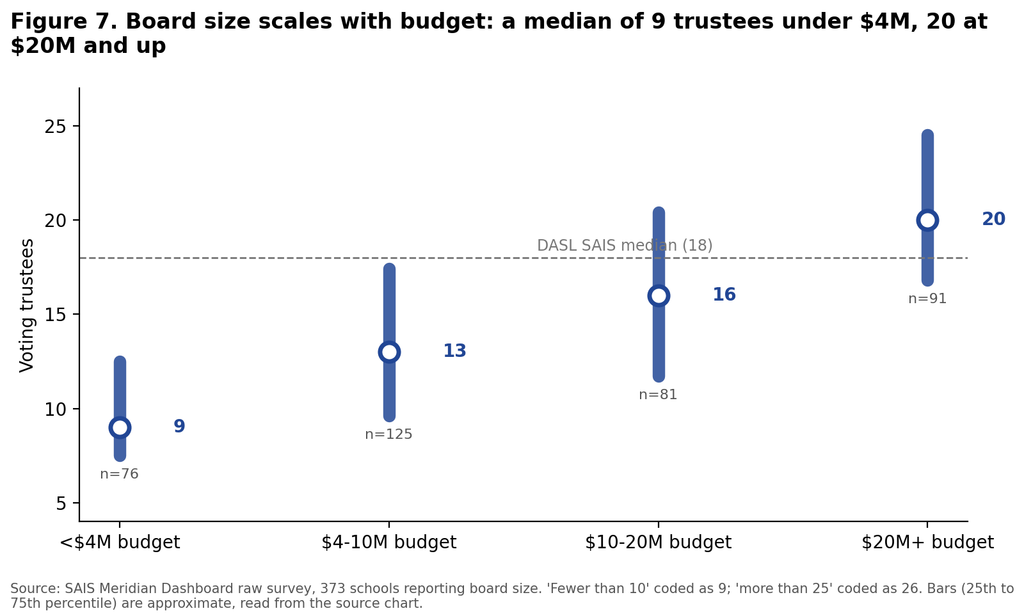
One caution: 23% of respondents chose “fewer than 10,” including six schools with more than 1,200 students. That option sits first in the survey’s list, and I suspect it caught some hasty clicks; I treat it as a probable input error.
Nearly Half of Boards are Majority-Parent Boards
Figure 8 shows current parents as a share of voting trustees. The distribution is nearly bimodal: 21% of boards have almost no current parents (0-10%), and 47% have a current parent majority. Current parent share rises with enrollment (rho = 0.33, p < 0.001), except at the smallest schools: only 30% of under-$4M boards are current parent-majority versus roughly half in every larger band. Religious affiliation makes no difference (p = 0.65).
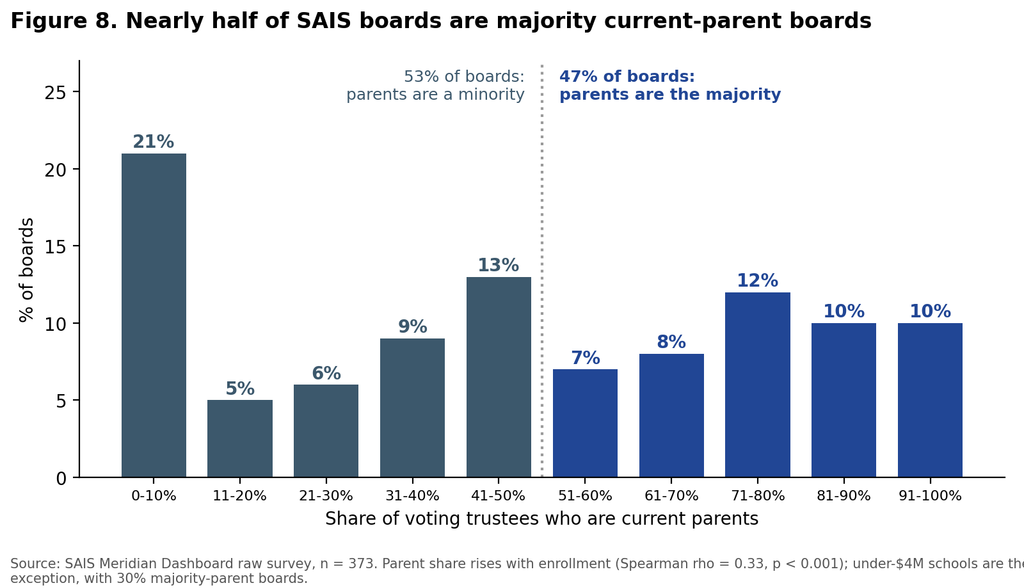
This matters for the GHI’s external-engagement gap. A board made up mostly of current parents may skew toward the school’s current state and, in particular, their children’s experiences. Parent-majority boards, however, are no less likely to have an advancement committee (75% versus 66%, p = 0.08), so the committee is there. What Meridian cannot tell us, and the GHI suggests, is that the committee’s reach is limited by who sits on it.
Term Limits are Everywhere; Rotation is Not
Figure 9 is the structural echo of the GHI succession finding. Eighty percent of boards impose term limits on the chair, 82% on trustees, and 78% use a three-year term. Is that good news? The other panel shows that 26% of boards allow unlimited consecutive terms and 4% allow four or more. A three-year term with no cap on renewals is a term limit in name only.
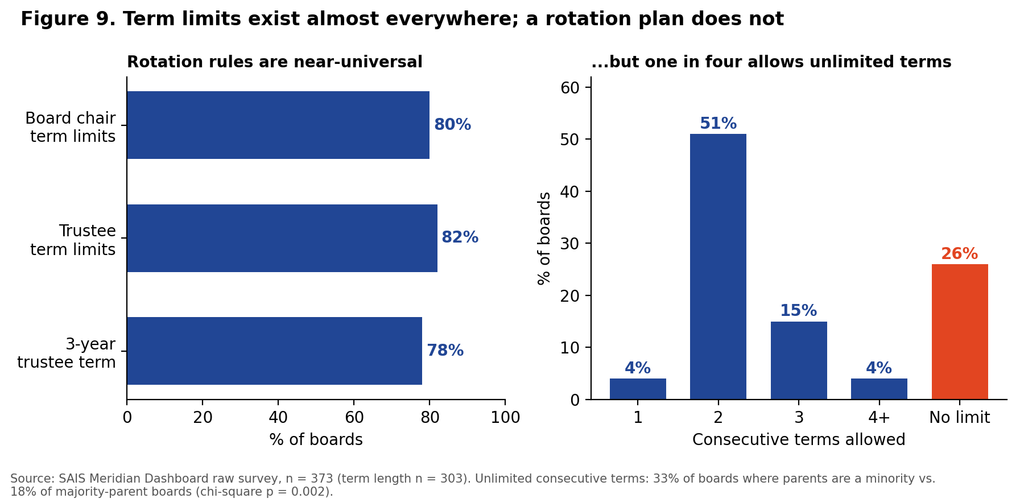
Two associations are worth knowing. Unlimited renewal is significantly more common where current parents are a minority (33%) than on parent-majority boards (18%; chi-square p = 0.002), which makes sense: parents cycle off when their children graduate, so parent-heavy boards get rotation for free while non-parent boards must impose it. Unlimited renewal also declines with budget, from 37% under $4M to 18% at $20M and up (p = 0.054, just short of significance). Put that beside the GHI: one in four trustees says succession planning is limited or developing, and three in four boards have “forced” succession through firm term limits. Those are probably not different quarters.
Committees: Built for Money, Not for Strategy
Figure 10 lists every standing committee in the survey, colored by the GHI competency it most nearly serves. The top five, at 60% to 94% prevalence, are finance, advancement, executive, governance, and buildings and grounds: the oversight and fundraising apparatus. Below them, the curve falls off a cliff. Strategic planning, the Bulletin’s theme this month, exists at 26% of boards. Compensation and head evaluation are at 17%. Innovation, the GHI’s sixth competency, has a standing committee at two schools out of 363. As with Currey Ingram’s “Planning Committee,” however, innovation and strategy may live under another name, but a committee’s absence still signals where a board expects to spend its time. The competency where boards score lowest, Community Engagement, is served by the second most common committee; the competency the Bulletin is asking about is served by one that three boards in four do not have.
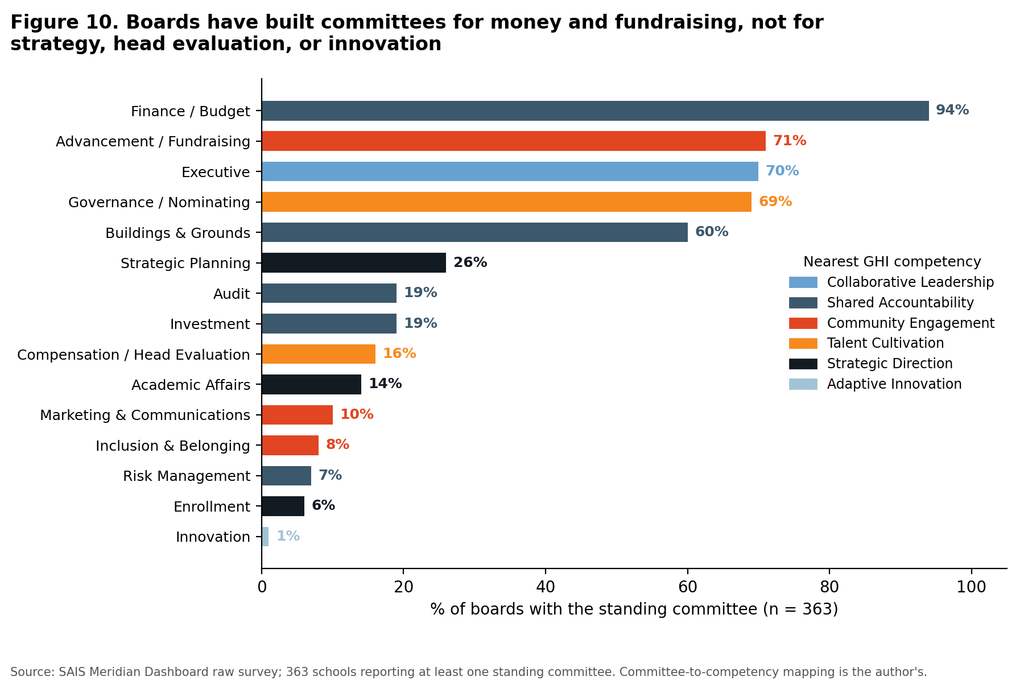
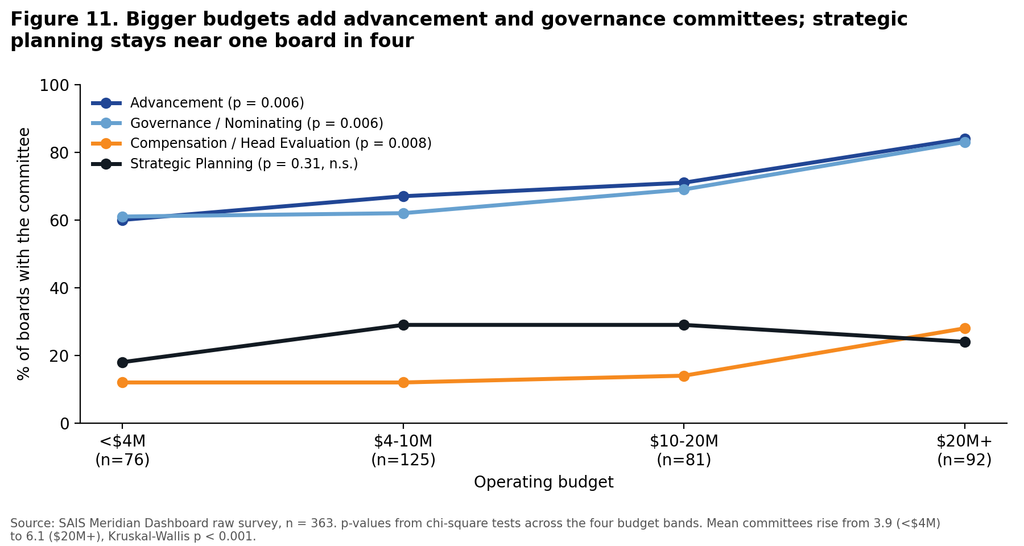
Figure 11 tests whether this is simply a function of size. Mostly it is: standing committees rise from a mean of 3.9 under $4M to 6.1 at $20M and up (Kruskal-Wallis p < 0.001), and advancement (60% to 84%, p = 0.006), governance (61% to 83%, p = 0.006), and compensation/head evaluation (12% to 28%, p = 0.008) all become significantly more common as budgets grow, as do audit, investment, facilities, and inclusion (all p < 0.01). Strategic planning is the exception: 18% to 29% in every band, with no significant difference (p = 0.31). Big schools add committees for money and people; they do not add one for direction, it seems.
Bylaws and the Recruiting Signal
Meridian asks for the bylaw minimum and maximum count of trustees alongside the actual count, which answers a question I have never seen answered: where do boards sit within their own allowed range? Figure 12 uses the 212 schools. The median range is eight seats, and the median board sits 60% of the way from floor to ceiling. Half of boards are within two seats of their maximum, and 22% are at or above it, which is either a bylaws-revision item or a nominating committee with more candidates than seats.
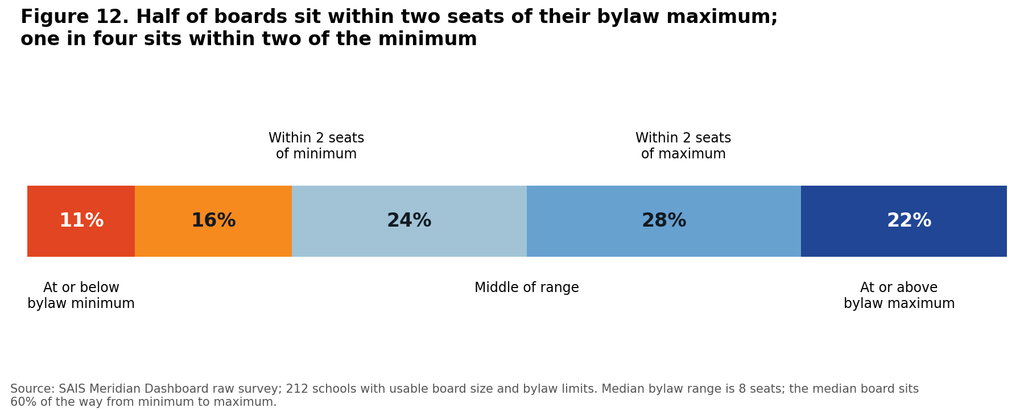
The other tail is the one I would watch. Eleven percent of boards are at or below their minimum, and 26% are within two seats of it; schools under $10M sit at the midpoint of their range, schools over $10M two-thirds of the way up. A board hovering near its floor usually can’t find or keep trustees, and that is the Talent Cultivation problem showing up in the bylaws before it shows up in a self-evaluation.
The Under-Used Lever: Non-Trustees on Committees
Two-thirds of boards (67%) let non-trustees serve on committees, and the pattern by budget is U-shaped: 78% under $4M, 55% at $4-10M, 74% at $20M and up (p = 0.003). Small schools use it from necessity, large schools by design, and the middle band, where most SAIS schools live, less so. It is the most obvious answer to the doorway problem the GHI identifies: the committee seat is where a school can audition the potential trustee.
Part 3. What Boards Believe: the Governance Health Index
SAIS built the GHI to evaluate boards against six competencies rather than a compliance checklist, each defined jointly for head and board, with a four-level reflection scale, key questions, and a discussion scenario. It is a shared vocabulary for the board-head partnership; its greatest value may be that heads and trustees are finally rating the same things on the same scale. The table summarizes the framework and what SAIS learned from the 2025-26 pilot.
| Competency | What it covers | Reflection scale (low to high) | Where SAIS boards stand (2025-26 pilot) |
| Collaborative Leadership | Board-head partnership, role clarity, trust, communication | Disconnected, Developing, Coordinated, Optimized | Clear strength. More than 60% of trustees rate it exemplary. |
| Community Engagement | Ambassadorship, external partnerships, support for fundraising and donor relations | Isolated, Aware, Involved, Connected | Clear weakness. 39% rate fundraising support 1 or 2; 27% external partnerships. |
| Strategic Direction | Mission, long-range vision, strategic targets, monitoring progress | Undefined, Emerging, Aligned, Integrated | Not yet summarized; the October Bulletin theme. |
| Talent Cultivation | Recruiting and developing trustees, the head, and faculty; succession | Underdeveloped, Limited, Emerging, Empowering | Concern. 23-25% rate succession and trustee development 1 or 2. |
| Shared Accountability | Shared goals, board and head evaluation, compliance oversight | Fragmented, Developing, Consistent, Dynamic | Not yet summarized. |
| Adaptive Innovation | Trend scanning, pilots, risk-and-return frameworks for new initiatives | Static, Reactive, Proactive, Innovative | Not yet summarized. |
Two features deserve a head’s attention. The scales are behavioral, not aspirational, so a board can locate itself honestly on the ladder in ten minutes. The framework also gives the board explicit responsibility for things boards often assume belong to the head: advocating for fundraising, developing the head through coaching, and approving investments in innovation. Those are the items where the pilot boards scored lowest.
Where Boards Rate Themselves Strong and Where They Do Not
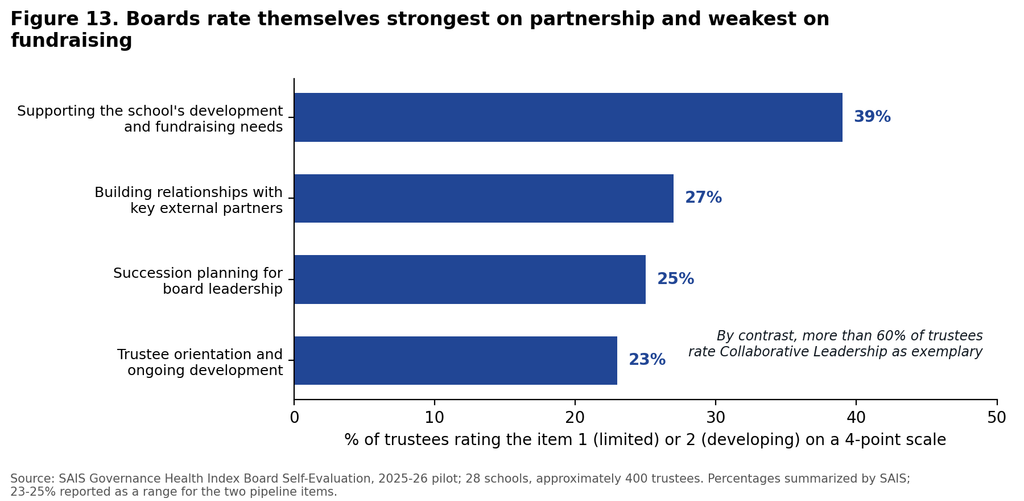
Figure 13 shows the share of trustees who rated selected items a 1 (limited) or 2 (developing), the bottom half of the scale, grouped by competency.
Collaborative Leadership is the clear strength. More than 60% of trustees rated the board-head relationship, trust, and communication as exemplary. Discount that for trustees’ generosity toward their own governance, and it is still a strong result, consistent with the earlier SAIS survey, where board-head items drew the highest agreement from heads and trustees alike. The inside of the house is in good order.
Community Engagement is the clear weakness. Nearly 39% rated their board’s support for development and fundraising as limited or developing, the survey’s single weakest item; relationships with key external partners were next, at 27%. Boards are comfortable governing the school and uncomfortable strategically representing it.
The trustee pipeline is the quieter concern. Between 23% and 25% rated succession planning and trustee orientation and development as limited or developing: one in four trustees was not adequately prepared for the role or saw no plan for who would lead the board next. SAIS’s read, which I share, is that these link back to engagement. Trustees receive limited fundraising training and are not comfortable with the ask, even though almost all give personally.
Connecting the Three Pictures
Set DASL and Meridian beside the GHI and a coherent story emerges. Trustees are doing the part of philanthropy that requires only a checkbook and a conscience: they give, they give more each year, and they do so unrequired. What they are not doing, by their own account, is the part that requires preparation and a plan: cultivating partners, opening doors, making the ask. The DASL pledge line, flat while receipts rose, is what that looks like in the ledger. Personal gifts land as receipts; cultivated relationships land as commitments.
A metaphor to consider with your board is the difference between a donor and a doorway. Every trustee can be a donor, and most already are. A doorway is a trustee who opens a relationship the head could not open alone. Boards in the GHI pilot are full of donors and short on doorways, and Meridian shows the architecture behind it: half the boards are built from current parents, and three in four have no strategic planning committee to define the ask. Nobody taught them how, nobody told them it was the job, and the structure was not designed to make it one.
What the Data Do Not Show
- Causation. The pilot did not test whether boards with fundraising training give or raise more. The link between low engagement scores and flat commitments is suggestive, not proven, and the 28 pilot schools chose to participate, which itself signals seriousness about governance.
- Structure is not outcome. Meridian records whether a committee or rule exists, not whether it works, and holds no giving data, so it cannot test whether parent-majority boards or strategic planning committees move trustee dollars. The tests show that structural differences by school size are real, not that structure causes performance.
- Self-reported categories. Board size, parent share, and budget are banded self-reports, and the “fewer than 10” option almost certainly absorbed misclicks. Banding slightly understates correlations; direction and significance are reliable, exact coefficients less so.
- The head’s view. The GHI is trustees rating their own boards. In 2016-2019, heads consistently rated governance practice lower than trustees did; if that holds, the true share of boards struggling with engagement and succession is higher than reported here.
- School type. DASL medians pool day and boarding, K-8 and PK-12, $10K and $50K tuitions. Use the quartiles for orientation and your own DASL peer group for the real comparison.
- The other competencies. SAIS’s summary covered Collaborative Leadership, Community Engagement, and Talent Cultivation. Item-level results for Strategic Direction, Shared Accountability, and Adaptive Innovation would sharpen this analysis, and I hope to include them in a follow-up.
What I Would Actually Do
For a chair or head reading this before an October board meeting, here is the short list. Each item maps to a GHI competency and fits inside a single board year.
- Put your own trustee numbers on one page. Participation rate, dollars received, and new commitments for the last three years against the DASL quartiles in Figures 3 and 4. If commitments are flat while receipts rise, name it as a leading indicator before it becomes a lagging one. (Shared Accountability)
- Replace the “give or get” debate with a training hour. Four in five boards have no giving requirement and reach near-full participation anyway; the scarce resource is not willingness to give but confidence to ask. One 60-minute session a year, led by the head and advancement director, in which every trustee practices a single cultivation conversation, will move the 39% more than any policy will. (Community Engagement)
- Assign every trustee one doorway, and use committee seats to build the next ones. Not a solicitation, a relationship: a foundation officer, a civic leader, an alumnus, a prospective family the trustee already knows, tracked on the same page as the giving numbers. Then seat non-trustees on committees, the lever two-thirds of boards already have and the middle band under-uses. It is the cleanest way for a parent-majority board to audition the external partners it lacks and a two-year trustee pipeline hiding in plain sight. (Community Engagement, Talent Cultivation)
- Write the succession plan down. One page naming the next chair, the next two committee chairs, and the development pathway that gets them there. One in four trustees says this does not exist, and one in four boards has no cap on renewals to force the question; two consecutive three-year terms, the choice of half of SAIS boards, is the norm for a reason. If your board is within two seats of its bylaw minimum, the recruiting problem is already under way. (Talent Cultivation)
- Rebuild orientation around the GHI. Replace the binder and campus tour with the six competencies, the role definitions for head and board, and one framework scenario discussed as a group. A trustee who has argued through the tuition-backlash scenario before it happens will not field parent complaints around the head when it does. (Talent Cultivation, Collaborative Leadership)
- Make Strategic Direction the reason to ask. Trustees hesitate to ask because they are not sure what they are asking for. A board that can say, in two sentences, where the school will be in five years and what it will take to get there has already written the case statement. Three boards in four have no strategic planning committee, and size does not change that; if yours is one, the executive committee should own the paragraph, and November’s meeting should go to it before it goes to the annual fund. (Strategic Direction)
Questions for Your Next Board Meeting
Drawn from the GHI key questions, chosen for the gaps the data exposed:
- How do we support advancement, fundraising, and donor relations, and can each trustee describe their own role in it?
- What external partnerships (civic, philanthropic, corporate) should we be cultivating, and who on this board owns each one?
- How do we onboard, mentor, and develop new trustees, and would a trustee who joined last year say it worked?
- Who leads this board in three years, and what are we doing now to prepare them?
- How are we monitoring progress toward strategic goals, and are we asking the right questions about market trends, enrollment, and program relevance?
- Do we know who we are? When did this board last review its composition against the skills and backgrounds the strategic plan requires?
- Which committee owns strategic direction, and where does our board sit relative to its own bylaw range and term-renewal rules?
Closing
A generous board is a gift, and SAIS schools have them. But generosity that stays inside the boardroom is a candle under a bushel. The GHI gives boards a vocabulary for the difference between giving and leading; DASL gives them the numbers to measure it; Meridian shows the structure that has to change for the numbers to move. The work of the coming year is to turn donors into doorways, and the data says the boards most likely to succeed are the ones that already trust their heads. That trust is the strongest asset in this entire dataset. Spend it outward.
Sources and Notes
- NAIS DASL, custom report generated September 23, 2026: Trustee Donations ($ Donated, Donor Count), Trustee New Funds Committed, Number of Trustees, Trustee Donation Requirement, and Trustee Race/Ethnicity Data Collected, for All NAIS Member Schools (n = 1,718) and Assoc-SAIS (n = 345), data-entry years 2023-24 through 2025-26. Percent changes in Figures 3-5 are computed on reported percentile values across years, not on a matched panel of schools.
- SAIS Meridian Dashboard, raw board-structure survey responses (September 2026 extract), n = 373. Tests: chi-square for committee presence and rotation rules by budget band and parent-majority status; Spearman rank correlation for board size and parent share against enrollment band; Kruskal-Wallis for committee counts across budget bands. Budget bands: under $4M (n = 76), $4-10M (125), $10-20M (81), $20M and up (92).
- SAIS Governance Health Index and the 2025-26 GHI Board Self-Evaluation summary (28 schools, approximately 400 trustees), provided by SAIS.
- FastStats: Governance Beliefs and Practices in SAIS Schools (SAIS Governance Surveys, 2016-2019; 49 heads and 784 trustees).