
Over the past year, 6,413 parents from a wide range of independent schools completed the SAIS School Community Feedback Survey. Here is what stands out when we look at who is responding: how long they have been at their school, which divisions their children attend, and how many children they have enrolled. Most ratings use a 1 to 5 scale, and the labels vary by question. Learn from what other schools have already heard. The parent perspectives point to the areas worth a closer look at your school, before a small concern grows.
Designed specifically for independent schools, the SAIS School Community Feedback Survey gathers meaningful insights from your school community across every dimension of the school experience.
A sample of what the survey measures:
- How welcome and included community members feel, how well the school lives its mission, and opportunities for engagement
- Physical and mental well-being, challenge and growth, and the effectiveness of school policies
- Skill development across 12 areas, including analytical thinking, creativity, and collaboration
- Campus facilities, security measures, and emergency preparedness
The Overall Picture
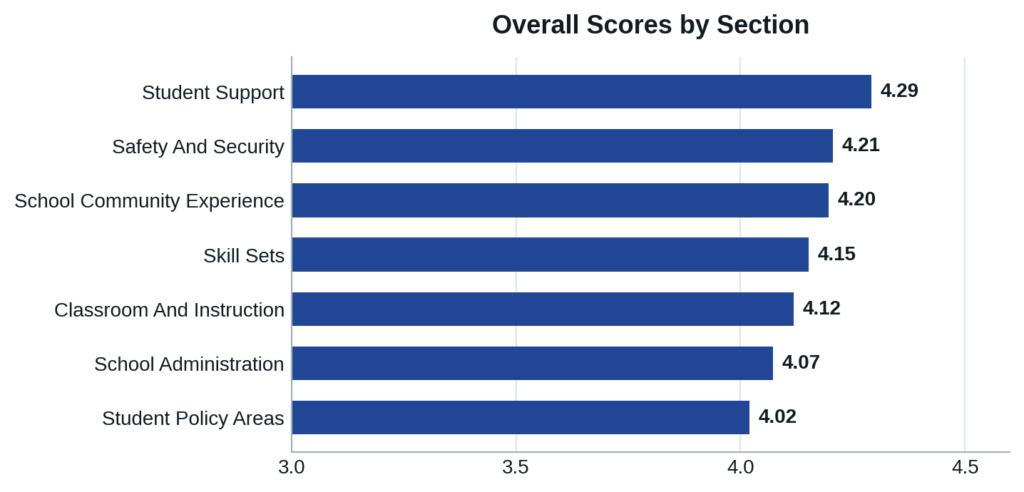
Parents rate student support and safety and security highest. Families feel welcomed, and they feel comfortable approaching teachers. The lower scores are around how the school addresses student social challenges, administration proactively addressing challenges, and parents feeling personally engaged in the school community.
The question on academic experience asks whether the experience has met expectations, a 3 is a good answer: 55% of parents say their student’s academic experience is above expectations, 33% say it is meeting expectations, and 12% say it is below.
Parent Tenure
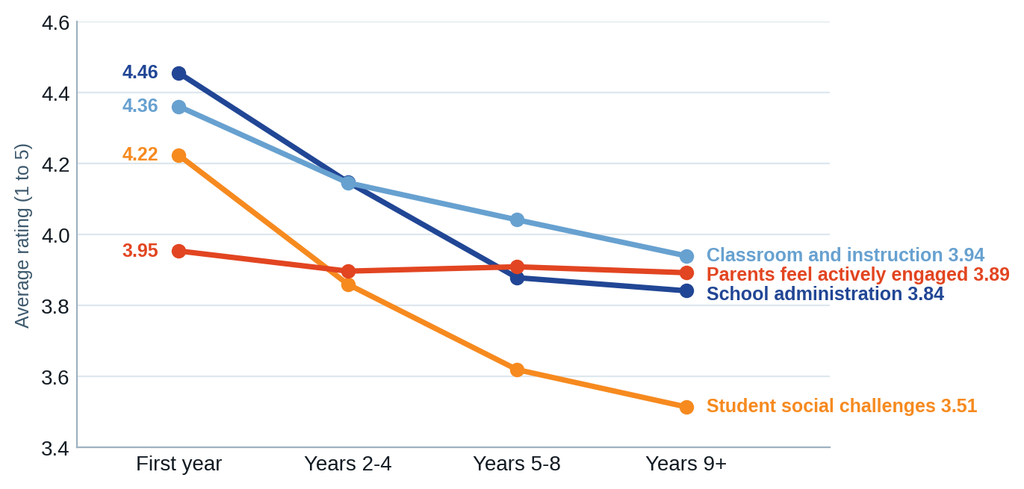
The strongest pattern in the data is tenure. First-year families rate school administration 4.46; families enrolled nine or more years rate it 3.84. Classroom and instruction falls more gently, from 4.36 to 3.94. Every one of the 52 items rated on a favorable-to-unfavorable scale scores lower for the longest-tenured families than for first-year families. About half of the decline comes between the first year and years 2 to 4, and most of the rest by years 5 to 8.
The biggest gaps are in how parents see the school handle difficulty. Ratings for policies addressing student social challenges fall from 4.22 to 3.51, the largest drop of any item. Discipline, leadership, and responsiveness to concerns show similar drops of about 0.7 points. The one measure that barely moves is parents feeling actively engaged in the school community (3.95 to 3.89).
Willingness to recommend the school follows the same path. The Net Promoter Score falls from 70 for first-year families to 37 for families enrolled nine or more years. Over the same period, the share of parents who are unlikely to recommend the school grows from 7% to 19%.
Divisional Differences
Early childhood families are the most positive, with an overall score of 4.38, compared with 4.25 for lower grades, 4.14 for middle grades, and 4.08 for upper grades. Net promoter scores follow: 61, 49, 44, and 44. Safety ratings are steady across every division (4.15 to 4.21). Perceptions of homework shift after early childhood: 12% of early childhood parents say the load is somewhat or far too much, versus 22% in lower grades and about a quarter in middle and upper grades.
Skill Development
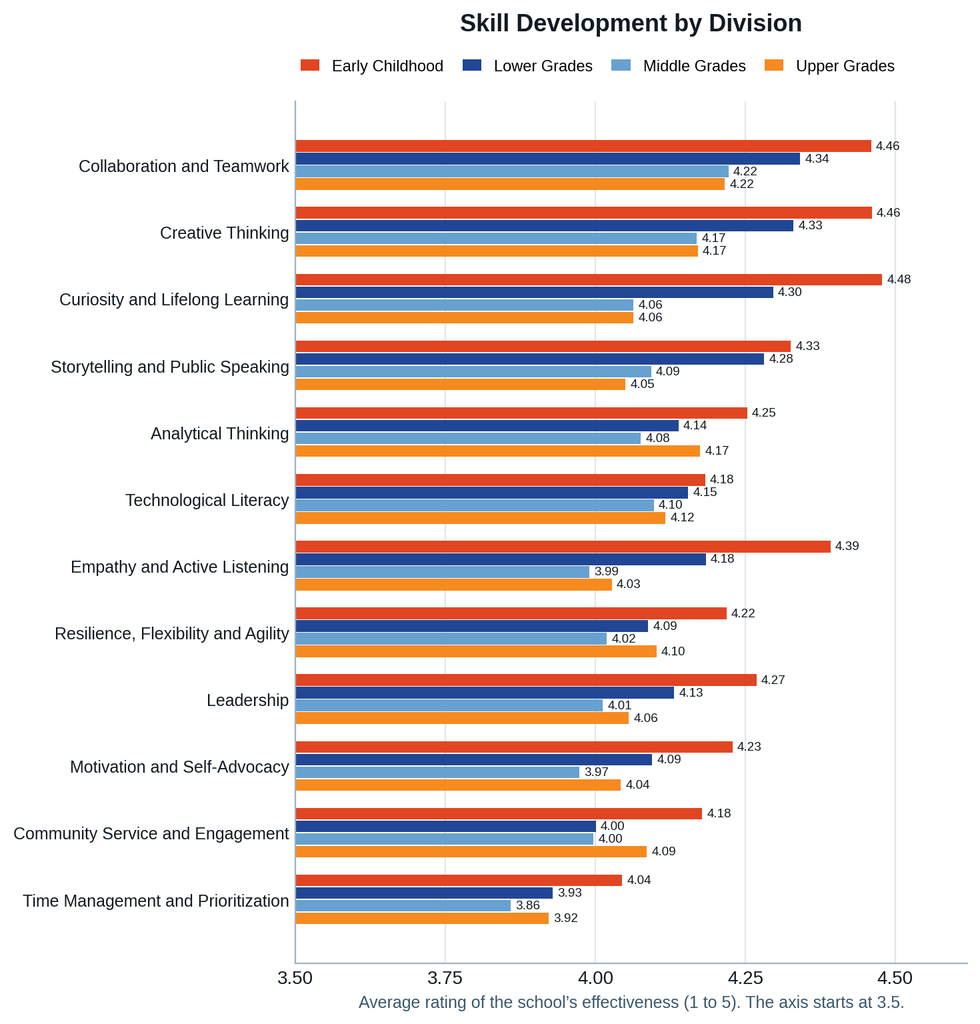
When asked, “How would you describe the school’s effectiveness in developing the following skills with your student?”, parents in every division rate their school’s skill development well, with individual skills averaging between 3.9 and 4.3. Early childhood families give the highest ratings on all 12 skills, especially on curiosity and lifelong learning, collaboration, creative thinking, and empathy and active listening. The gap widens once children reach middle school when empathy and curiosity fall. Analytical thinking and technological literacy hold steady across divisions.
Time Management: The Lowest-Rated Skill in Every Division
Time management and prioritization is the lowest-rated skill in every division, ranging from 3.86 in middle grades to 4.04 in early childhood. The gap is small but stable. Time management averages 3.94, versus 4.07 for the next-lowest skill, and it is lowest in every tenure group, race and ethnicity group, and family-size group as well. It runs about 0.2 points below the average of the other 11 skills in every division.
One possible explanation is that time management rarely has its own place in the curriculum, so parents may not see intentional instruction the way they do for public speaking or technology. Another is that parents see it up close at home, where missed deadlines and last-minute projects are easy to notice.
Top 5 Risk Areas for Schools to Watch
Schools tend to hear about a problem when a family is already leaving or has stopped recommending the school. The survey shows that warning signs appear long before that and that small problems stack up. Addressing a concern while it is still small is easier than rebuilding trust once it has been lost.
- Handling of student social challenges: 19% of parents rate the school’s approach as ineffective, 14% are neutral, and 67% rate it effective.
“How effective are the school’s policies and approach in the following areas?”
Item: “Addressing student social challenges (bullying, peer pressure, conflicts, etc.)” - Discipline and behavioral expectations: 15% rate the school’s approach ineffective, 9% are neutral, and 76% rate it effective.
Item: “Establishing & enforcing discipline & behavioral expectations” - Administration proactively addressing challenges: 12.5% disagree or strongly disagree, 19% are neutral, and 68% agree.
“Overall, how would you describe the school’s administration?”
Item: “Proactively addresses challenges and areas for improvement” - Academic experience below expectations: 12% say their student’s academic experience is somewhat or far below expectations.
“How would you rate your student(s) academic experience so far at your school?” - Academic standards seen as too low: 16% of parents say standards are somewhat or much too low.
“Overall, how would you describe the school’s academic standards?”
Mapping the Journey After Enrollment
Schools that map the admissions journey already know its value. The same exercise is just as valuable after a family says “yes”, and the SAIS School Community Feedback Survey shows why.
An admissions journey covers months, while a family’s relationship with the school can last a decade or more. Across 6,413 parent responses, first-year families are the most positive group: 76% would recommend their school (rating it 9 or 10 out of 10). Among families enrolled 9 or more years, 56% would recommend. The net promoter score falls from 70 to 37.
The decline begins right after the welcome. Administration ratings fall from 4.46 in a family’s first year to 4.15 at years 2 to 4, and the net promoter score falls from 70 to 52.
Admissions promises are tested after enrollment. What a family hears while applying becomes the standard they hold the school to. A carefully designed admissions experience followed by an undesigned one sets families up for a gap between expectation and reality. High first-year scores suggest schools handle the welcome well. The challenge is sustaining it.
Every prospective family talks to current parents. Willingness to recommend measures how likely families are to speak well of the school, so an unhappy long-tenured family can quietly undercut the work of an admissions team.
To map the current family experience, define the stages, identify the moments that matter, name what families are likely feeling, assign an owner, and choose one thing to test. For enrolled families, the stages are the first year, years 2 to 4, years 5 to 8, and 9 or more, along with division transitions. See the Family Journey Map tool below.
Resources & Tools
Use these tools to turn the survey findings into action at your school.
Why This Matters to You
You don’t need your own survey data to learn from what 6,413 parents told other schools. These findings show what to look for, so you can start the conversation before a concern turns into a problem.
- The same risks show up everywhere. Handling of student social challenges was the most frequently low-rated item in every division and at every stage of a family’s time at the school.
- Trust tends to fade after the first year. Willingness to recommend falls from a net promoter score of 70 for first-year families to 37 for families enrolled 9 or more years.
- Concerns add up. Families with no concerns in the five risk areas highlighted on this page have a net promoter score of 77. Families with three or more have a score of −58.
- Your records can’t show it all. Enrollment numbers tell you who left, but not who is unhappy and still here.
Find out what your families think. Learn how the SAIS School Community Feedback Survey can show you your own results.